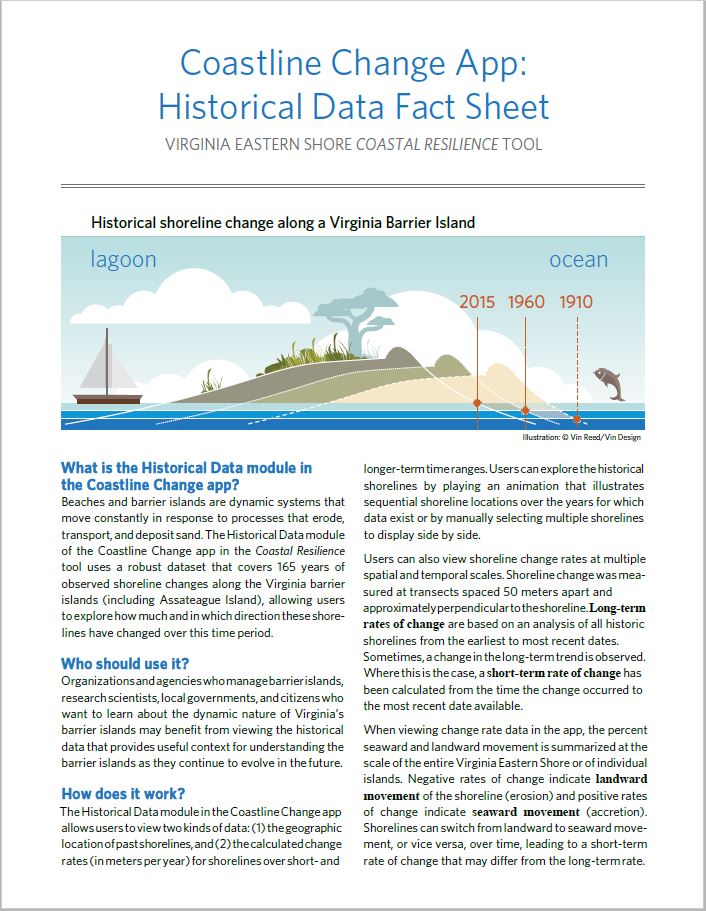
Coastline Change: Historical Data
What is the Coastline Change: Historical Data app?
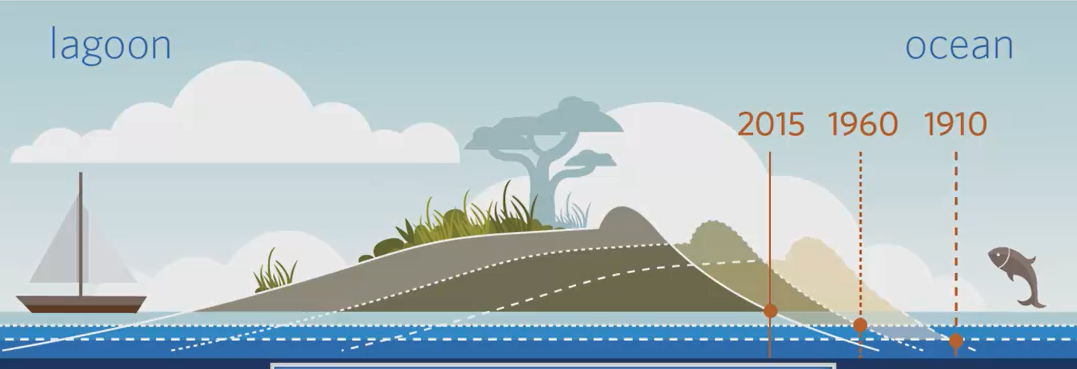
![]() Beaches and barrier islands are dynamic systems that move constantly in response to processes that erode, transport, and deposit sand. The Historical Data module of the Coastline Change app in the Coastal Resilience tool uses a robust dataset that covers 165 years of observed shoreline changes along the Virginia barrier islands (including Assateague Island), allowing users to explore how much and in which direction these shorelines have changed over this time period.
Beaches and barrier islands are dynamic systems that move constantly in response to processes that erode, transport, and deposit sand. The Historical Data module of the Coastline Change app in the Coastal Resilience tool uses a robust dataset that covers 165 years of observed shoreline changes along the Virginia barrier islands (including Assateague Island), allowing users to explore how much and in which direction these shorelines have changed over this time period.

Who should use it?
Organizations and agencies who manage barrier islands, research scientists, local governments, and citizens who want to learn about the dynamic nature of Virginia’s barrier islands may benefit from viewing the historical data that provides useful context for understanding the barrier islands as they continue to evolve in the future.
How does it work?
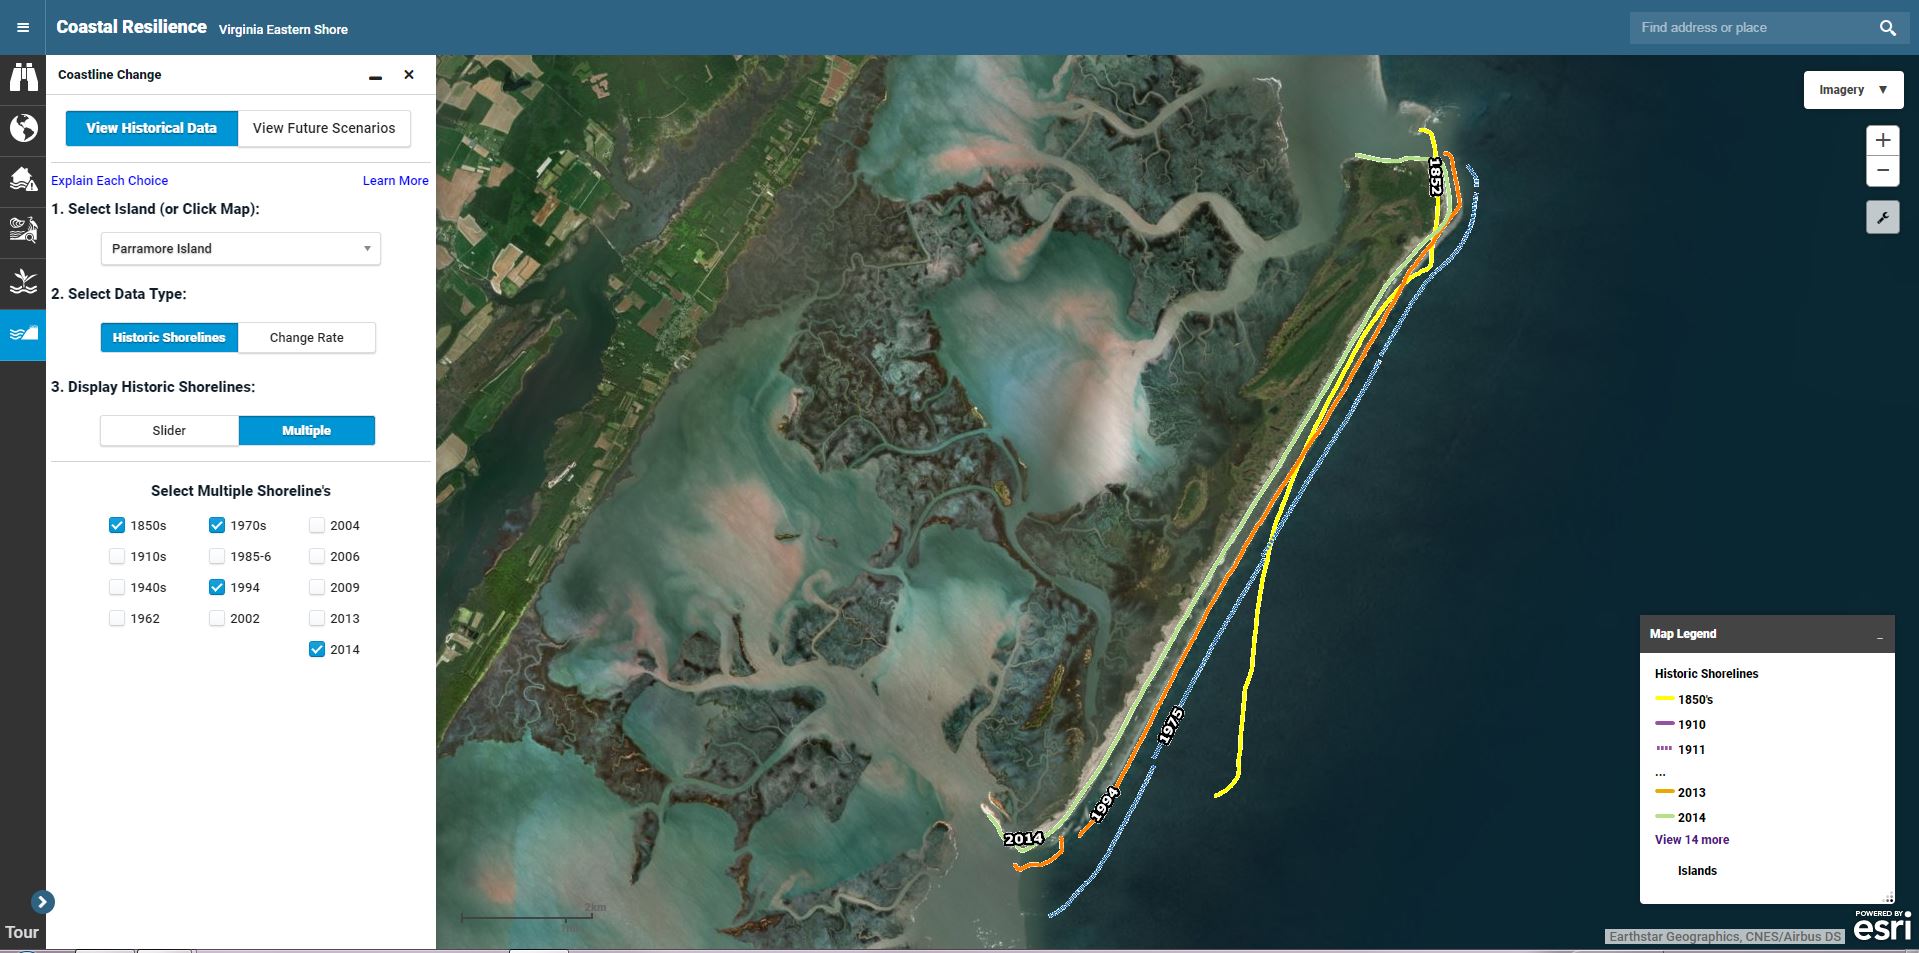
The Historical Data module in the Coastline Change app allows users to view two kinds of data: (1) the geographic location of past shorelines, and (2) the calculated change rates (in meters per year) for shorelines over short- and longer-term time ranges.
- Users can explore the historical shorelines by playing an animation that illustrates sequential shoreline locations over the years for which data exist or by manually selecting multiple shorelines to display side by side.
- Users can also view shoreline change rates at multiple spatial and temporal scales.
- Shoreline change was measured at transects spaced 50 meters apart and approximately perpendicular to the shoreline. Long-term rates of change are based on an analysis of all historic shorelines from the earliest to most recent dates.
- Sometimes, a change in the long-term trend is observed. Where this is the case, a short-term rate of change has been calculated from the time the change occurred to the most recent date available.
- When viewing change rate data in the app, the percent seaward and landward movement is summarized at the scale of the entire Virginia Eastern Shore or of individual islands.
- Negative rates of change indicate landward movement of the shoreline (erosion) and positive rates of change indicate seaward movement (accretion).
- Shorelines can switch from landward to seaward movement, or vice versa, over time, leading to a short-term rate of change that may differ from the long-term rate.

Additional data about shoreline trends are available for individual transects on the islands, including the rate of change in meters per year, the time span of the earliest and latest date, and the number of shoreline positions measured to calculate the change rate.
What are the strengths and limitations?
Strengths: The historic shoreline data presented in the Coastline Change app are among the most comprehensive and long-term datasets describing shoreline change anywhere in the world, including 38 unique years of data spanning 1850-2014.
Limitations:
- However, it is important to recognize that quantifying shoreline positions is only a proxy for how coastal processes such as sea-level rise, storms and sediment dynamics impact barrier islands and cause them to move in space and time.
- While a good proxy for island movement—and a proxy used by many federal and state coastal management agencies— shoreline change rates do not provide correlations with, or information about, the coastal processes that produce the shape changes to islands over time.
- In addition, there are sources of error in these data. Digitizing shorelines from paper maps may introduce more error into shoreline rate of change calculations than digitizing shorelines from aerial photos because the on-ground survey techniques did not always use the same techniques or the same sea-level datum. Aerial photographs (or orthophotographs) provide actual imagery of a beach, but contain potential distortion error. Fortunately, the amount of error introduced into shoreline rate of change calculations by comparing different shorelines decreases as the amount of time between the earliest (oldest) recorded shoreline and latest (most recent) recorded shoreline increases.
Who helped develop it?
The Historical Data module of the Coastline Change app was developed by a partnership between Randolph-Macon College, University of Mary Washington, The Nature Conservancy, NASA-Wallops Flight Facility, National Park Service Assateague Island National Seashore, U.S. Fish and Wildlife Service Chincoteague National Wildlife Refuge, the Accomack-Northampton Planning District Commission, and the Virginia Coast Reserve Long Term Ecological Project.